Every 13F filing,
monitored in real time

Follow institutional filings the moment they hit SEC EDGAR — live feed, AUM rankings, smart-money signals, flows, crowding and portfolio quant analytics, with a Claude executive summary and quantitative email alerts on the institutions you watch.
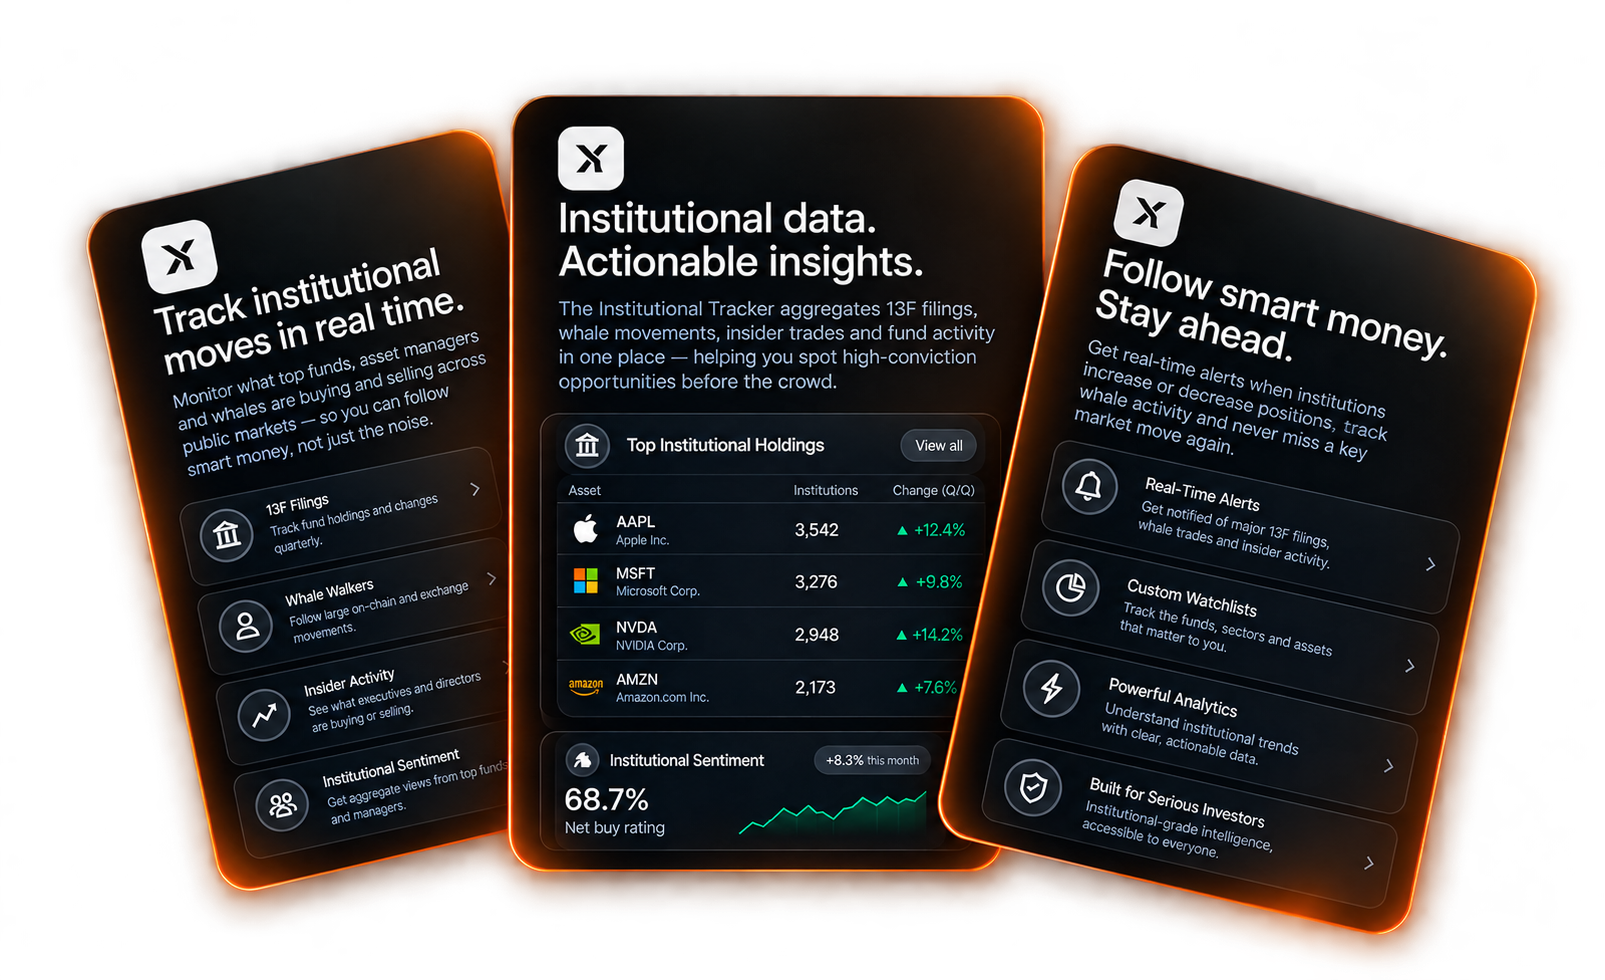

Mextyl Institutional Tracker: live 13F feed, institution rankings, smart-money signals, flows, crowding and AI executive summary
Smart-Money Signals

6 signals.
One "To watch" radar.

Every indexed institution is scored automatically each quarter. The strongest signals surface first, and your watchlist is always ranked on top.

Accumulating Flow

Portfolio value up sharply quarter-over-quarter, with at least as many new positions as closed ones. Signals active buying.

Threshold: ≥ +20% QoQ

Reducing Flow

Portfolio value down sharply versus the prior quarter. Signals de-risking or offloading — value changes include price effects.

Threshold: ≤ −20% QoQ

Rotation Turnover

Many positions opened and closed in a single quarter. Signals a strategic repositioning of the book.

Threshold: ≥ 15 new + closed

Concentrated Structure

Top 10 holdings dominate the portfolio. Flagged as a high-conviction, low-diversification book.

Threshold: Top 10 ≥ 70%

High Conviction Structure

A single position weighs a very large share of the portfolio. The name is displayed directly in the signal tag.

Threshold: top position ≥ 15%

Watched Stocks Watchlist

Add stocks by name or CUSIP. Any institution holding one in its top 10 is flagged and ranked first.

Match: name or CUSIP in top 10
Scroll for more
One monitor. Ten tabs.

Professional-grade
institutional analytics.

From the live filings feed to portfolio-level quant risk — everything you need to read smart money, in one workspace.

SEC 13F
LIVE FEED
SMART MONEY
CROWDING
By Monitor Tab

Live Feed, Rankings & To Watch

Follow 13F filings as they are accepted by the SEC, rank institutions by AUM and surface the strongest signals.

3 Tabs · Real-Time
EDGAR filings → ranked signals
Live feed: holdings reports, amendments, notices (ET)
Top institutions by AUM, biggest QoQ movers, consensus positions
"To watch" radar with signal score per institution

Stock Ownership, Flows & Compare

Find who owns any stock, see where money is moving and compare up to four institutions side by side.

3 Tabs · Cross-Institution
Holders → net flows → overlap
Holders by name or CUSIP with QoQ status (new, added, reduced, exit)
Net accumulation and distribution, global or on your watchlist
Compare: HHI, portfolio overlap, common holdings, unique bets

Crowding & Ownership Breadth

Measure how many filers hold each stock and whether positioning is building up or unwinding.

1 Tab · Market-Wide
Breadth → change → unwind risk
% of filers holding each stock, with Δ breadth vs prior quarter
Most crowded, emerging and unwinding names
Breadth-vs-change bubble chart sized by value

Quant Portfolio Analytics

Up to 8 quarters of 13F history turned into concentration, attribution, risk and benchmark-relative statistics.

1 Tab · 20+ Charts
Concentration → risk → backtest
HHI, Gini, Lorenz curve, turnover, price vs trade attribution
Beta, alpha, tracking error, active share, risk contribution, stress test
Manager quality score and "follow the 13F" backtest

Quantitative Alerts & Claude AI

Get emailed when a rule triggers on a new quarter, and ask Claude about the data currently on screen.

1 Tab · AI Assistant
Rules → email → AI summary
5 alert types: position move, new, closed, concentration, AUM change
AI executive summary of the current tab, with thinking stream
Chat assistant with presets: takeaways, movers, signals, watchlist
Quant Metrics

8 quant metrics.
Computed from 13F history.

Relative positioning, benchmark risk and downside statistics on every institution — with clear methodology and no black box.

Active Share

How different the portfolio is from the aggregate 13F market.

Beta

Sensitivity of the passive return versus SPY, QQQ, IWM, DIA, VTI or ACWI.

Alpha

Annualised CAPM excess return not explained by market beta.

Tracking Error & IR

Volatility of active returns and return earned per unit of active risk.

Sharpe Ratio

Annualised risk-adjusted return with an adjustable risk-free rate.

Sortino Ratio

Return per unit of downside deviation only. Also shows Calmar ratio.

Max Drawdown

Largest peak-to-trough decline of the quarter-end passive series.

VaR & CVaR 95%

Parametric one-quarter loss and tail loss — indicative, shown from 3+ quarters.

Methodology: 13F filings cover long US equity positions at quarter-end only. "Passive return" is the weighted price return of carried-over holdings — a descriptive proxy, not fund performance.

Scroll for more
Track smart money in 3 simple steps
Smart money tracked in 3 simple steps.

From SEC EDGAR to a Claude executive summary and an email alert — automatically.

01

Build your watchlist

Browse the live feed and AUM rankings, then star institutions and add stocks by name or CUSIP. New filings are indexed automatically.

02

Analyze flows & risk

Signals, flows, crowding, overlap, active share, beta and drawdown are computed from up to 8 quarters of 13F positions.

03

Get AI summaries & alerts

Generate a Claude executive summary of the tab on screen, ask follow-up questions, and receive quantitative alerts by email.

Ready to track
smart money?

Join analysts and investors using the Mextyl Institutional Tracker to follow 13F filings live, spot accumulation and crowding early, and let Claude summarize what matters.

Alphy
AI Sales Assistant
Welcome to Mextyl! I'm Alphy, your AI Sales Assistant. Are you interested in learning more about how Mextyl can help your investment firm centralize data, deal flow and AI agents?
By sending a message, you acknowledge you have read and consent to our Privacy Policy. You agree this chat may be monitored, recorded, used for analytics and other business services as described in our Privacy Policy.
Mextyl Mextyl

Privacy Preference Center

When you visit our website, it may store or retrieve information in your browser, mostly in the form of cookies. This information may be about you, your preferences or your device and is used to make the site work as expected. It does not usually identify you directly, but it helps us provide a more relevant experience. You can choose not to allow certain types of cookies below. Blocking some categories may impact the site's functionality.

Manage Consent Preferences

Performance Cookies
These cookies allow us to measure traffic and analyze how visitors use our site, so we can improve performance and user experience over time.
Functional Cookies
These cookies enable enhanced functionality, such as remembering your preferences (theme, language) and providing a more personalized experience.
Strictly Necessary Cookies
Always Active
These cookies are essential for the website to function properly, including authentication and security, and cannot be disabled.
Targeting Cookies
These cookies may be used to build a profile of your interests and show you relevant content on other sites.
Read our Privacy Policy for more information.
Suggested