Statements, ratios, financial-health scores, peer rankings and Claude executive summaries for every SEC-registered company — updated continuously from 10-K and 10-Q filings.
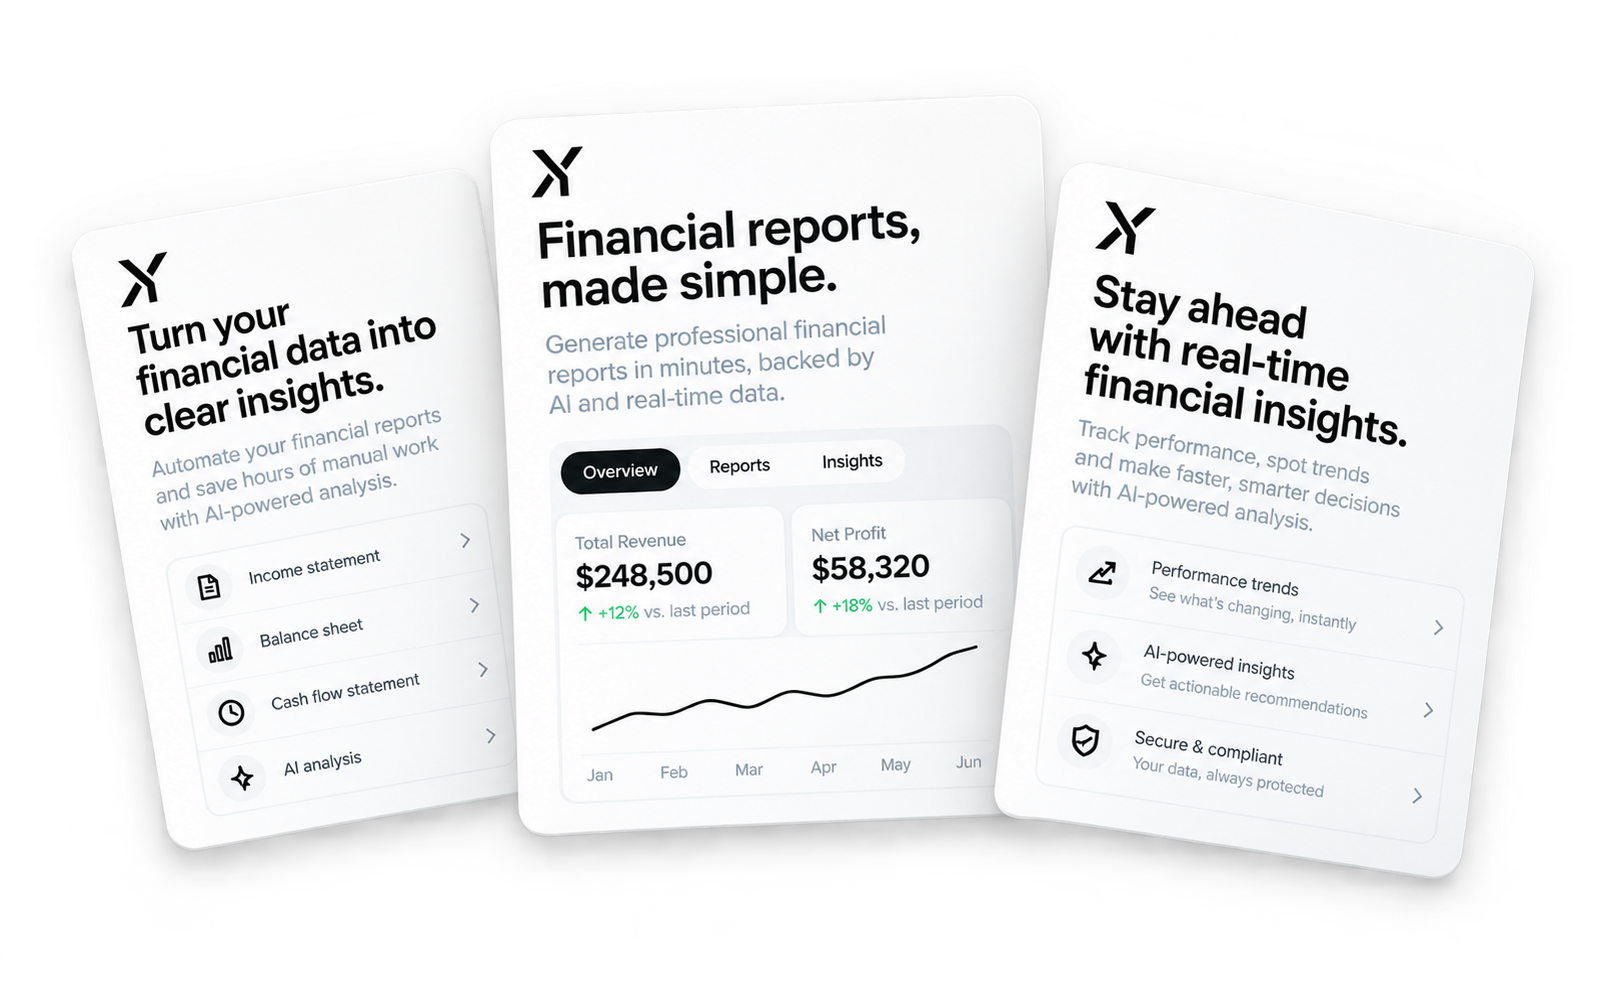
From the raw filing to peer-relative scoring — every layer of a company's financials, in one workspace.
One row per SEC-registered company. Filter by sector and exchange, switch between trailing 12 months and last fiscal year, and sort on any ratio.
Follow new annual and quarterly reports as they are filed, newest first, and open any document in the built-in reader.
Income statement, balance sheet and cash flow, annual or quarterly, with year-over-year changes and one-click export.
Market multiples, yields, cost of capital, economic value added and intrinsic-value cross-checks against the live price.
Altman Z-Score, Piotroski F-Score, leverage and liquidity, DuPont return decomposition and working-capital cycle.
Is profit backed by cash? A quality score with manipulation-risk, accruals and cash-conversion indicators, plus growth consistency and capital discipline.
A daily composite score and percentile profile versus industry peers, from Leader to Laggard, with strengths and weaknesses called out.
How each report compared with the company's own earnings history, how the market reacted, and the stock's typical reaction profile.
Put up to four companies next to each other on growth, profitability, valuation and financial health, with best and weakest values highlighted.
Follow companies and get emailed when a new report lands — by company, report type, form type or keyword.
An executive summary of whatever you are viewing, plus a chat grounded in the displayed SEC data: key takeaways, red flags, peers, metric explanations.
Price-based risk and volatility, technical indicators, backtests, seasonality, Monte Carlo simulation, options and position sizing for any listed stock.
Search any SEC-registered company by name, ticker or CIK and explore fundamentals, quality, peers, filings and quant analytics in a single place.
Overview, valuation, profitability and financial health — on a trailing-12-month or fiscal-year basis.
Judge the quality of the earnings, see where the company stands against its industry, and how the market reacts to its reports.
Go from the ratio back to the source: standardized statements and the original SEC documents.
Cross-read SEC fundamentals with statistical analysis of the stock's price behaviour. Available on the Enterprise plan.
From a company name to statements, scores, peers and an AI summary — all built on SEC filings.
Search by name, ticker or CIK — or filter the screener by sector and exchange and sort on any ratio.
Switch between trailing 12 months and fiscal year, then move through valuation, health, quality, peer positioning, report reactions, statements and filings.
Generate a Claude executive summary of what you are viewing, ask follow-up questions, and follow the company to be emailed when it files a new report.
Learn from the workflows, tips and best practices shared across our Learning Paths — curated from what our community reads the most.
Join analysts and investors using Mextyl Financial Reports to go from SEC filings to statements, scores, peer rankings and AI summaries in one workspace.